
Hello, folks. After a few weeks of cooling down (or heating up, according to the weather) for the committee, we’ve crunched the numbers on match statistics to bring you a look at how the forces fared in Operation Saltire III. For this surface-level look at the data we hope to bring a little insight into how Flames of War is played at our events, perhaps even making some observations that show greater trends in the game as a whole.
We’ll be presenting information on how well the players forces, factions and formations did across the slew of missions played on the weekend. This data was taken directly from Combat Command, who hosted the data collection for the event within their tournament system.
Foreword and Abstract
Some things to note before we dive in:
Firstly, the small amount of data available isn’t enough to confidently make claims about the state of Flames of War as a whole on its own. However, the data can be interpreted to indicate the presence of trends and start forming hypotheses about the state of the game.
Secondly, we’ve only pulled out pieces of information from the data we believe people may find interesting in this article. The full suite of information is made available to everyone under the “Source data” section.
Tournament results
To kick off the data analysis, here are the full tournament results in order of points gained:
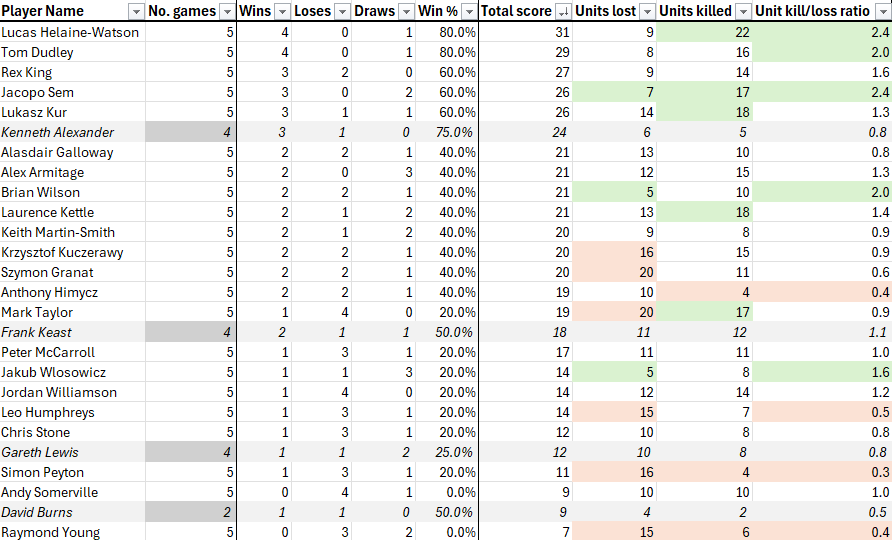
Table 1 – Player information
The data in Table 1 above highlights players who did not play all 5 games that day in grey. Not much to say at this point other than congratulations to the 26 players for playing a total of 62 games over the weekend! For now, we’ll get into the meat and bones behind their victories.
Forces
Of the Forces present on the weekend we had 5 unique Force types turn up at the tables due to our 2 Formation limit;
- Three single formation force types;
- Infantry Formation
- Tank Formation
- Mechanised Infantry Formation
- Two double formation force types
- Combined Tank/Infantry Formations
- Combined Tank/Mechanised Infantry Formations
Note: The Support options have not been considered in this fairly simplistic analysis.

Figure 1 – Match frequency of Force Type
We can see from Figure 1 that the most common Force is the Infantry-only Force, and the least common is a Tank/Mech. Infantry combo. The low number of games performed by the latter is worth taking into consideration when seeing the rest of the data. I’ve removed their data from some views as it may not be useful.
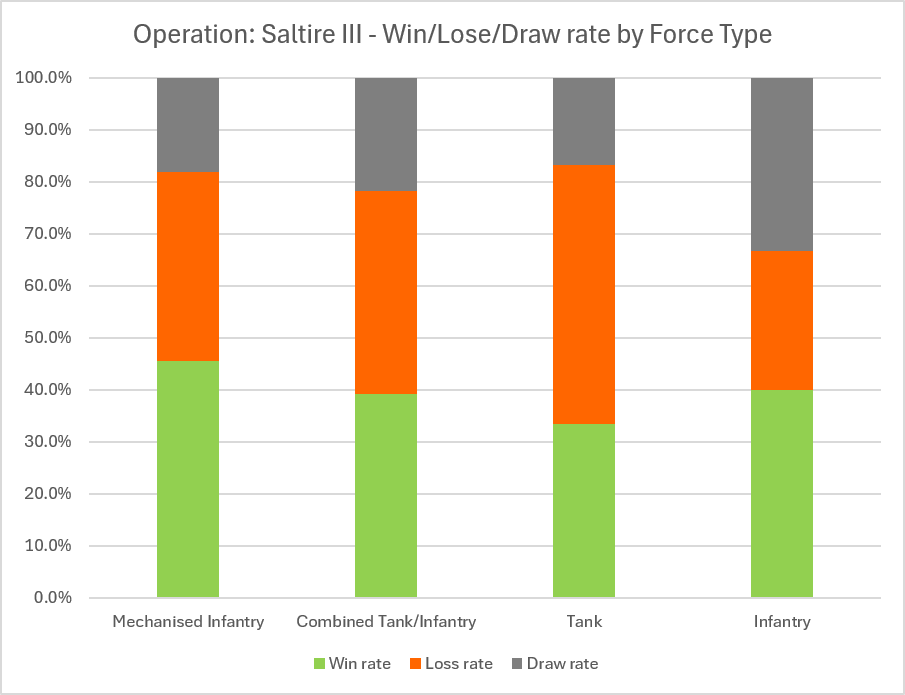
Figure 2 – Win/Lose/Draw rate by Force Type
Figure 2 shows the highest win rate Force type was the Mech. Infantry Force at over 45%, and the lowest was joint last between the Tank Force and a combined Tank/Mech. Infantry Force at 33.3%. Very surprising to see considering the recent point reductions in Tanks thanks to Dynamic Points.
Stances
Stances are almost as important as the choices we make in building our force. Here’s some basic information on how player stance choices affected games on the day.
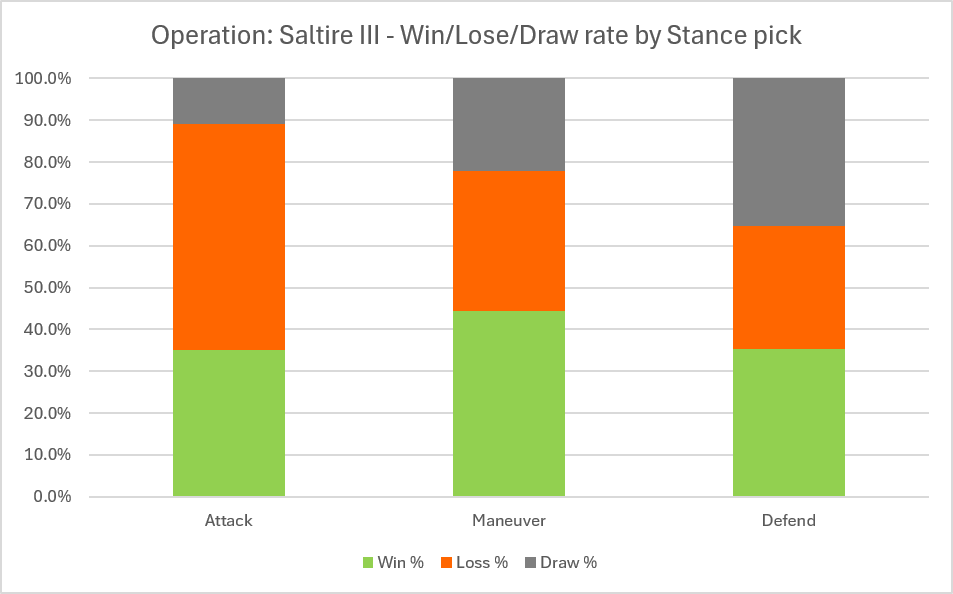
Figure 3 – Win/Lose/Draw rate by Stance pick
My own experience in this game was that “Attack” stance Forces typically take the trophies at tournaments, so I was personally surprised to see from the information on Table 2 that the higher win rate stance in Saltire III was the “Maneuver” pick at 44.4% win rate. “Attack” may result in the more decisive game with only 10.8% draw rate, however, and “Defend” the least at 35.3% draws.
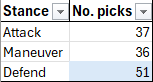
Table 2 – Stance frequency
“Defend” was also the most frequently picked stance in this tournament, likely due to the volume of Infantry Forces, as shown in Table 2.
It’s important to consider your choice of stance when designing your Force. However, rarely I think we consider that the choice of stance perhaps should be dynamic depending on the scenario.
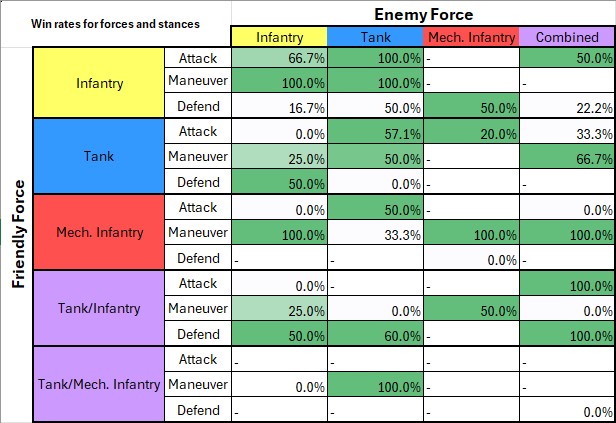
Figure 4 – Win rates for Forces and Stances
If you want a nice useful nugget of truth from this information then it should be Figure 4, which might give you a nice indication of how you should pick your stances when you’re up against a known Force. It’s worth keeping in mind from earlier that the low amount of data may cause us to see results here that are likely not representative of the state of the game as a whole. For example, it is quite hard to imagine Infantry Forces winning every single match against a Tank Force when the Infantry are attacking!
Formations
We had a total of 30 unique Formations across our players Forces on the weekend, quite the diverse turnout!

Table 3 – Formation turnout
In Table 3 above we can see that there is a lovely variety of choices at this tournament. The German Berlin Battle Group appeared in the most Forces and games, followed by the Soviet Hero Motor Rifle Battalion and German Beach Defence Grenadier Company. While this might give an enthusiast a nice indication of how well their Formation of choice may perform, again it’s worth reiterating that the low amount of data means we may not get the full picture. In this analysis the Formations that are used in fewer than 5 games are highlighted grey to show lack of data.

Figure 5 – Win/Lose/Draw rate by Formation
If you’d like to know how each Formation did in general, Figure 5 shows just that. Formations with only 1 game under their belt have been omitted from this Figure to keep the results clean. We can see that the Soviet Red Banner Rifle Regiment, American Battle Weary Rifle Company and German Panther Tank Company did very well for themselves with win rates between 75-80%. Conversely, the tank heavy Soviet Hero IS-2 (Late) Guards Heavy Tank Regiment, German Panzer Battle Group and Soviet IS-85 Guards Heavy Tank Regiment formations did poorly this year. Quite refreshing in my opinion to see aggressive infantry doing well even after the dynamic points changes.
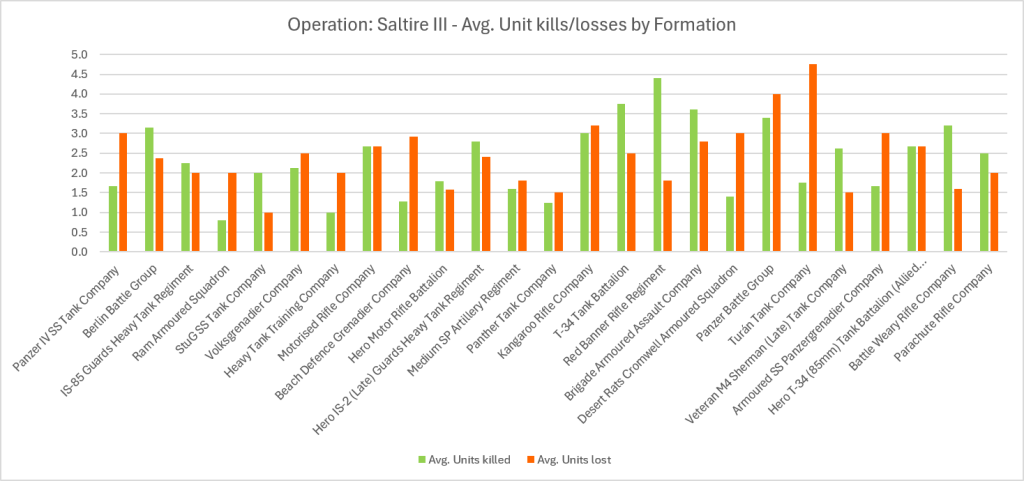
Figure 6 – Average Unit kills/losses by Formation
Figure 6 is a good indication of a Formation’s efficiency when it comes to the “Victory points” game of Flames of War. A Formation that loses fewer units will concede fewer points to their opponent. In terms of efficiency, the StuG SS Tank Company, Red Banner Rifle Regiment and Battle Weary Rifle Company perform very well, having double or more kills than losses. On the other hand, the Ram Armoured Squadron, Beach Defence Grenadier Company and Desert Rats Cromwell Armoured Squadron had half or less kills to unit losses. The StuG SS Tank Company and Veteran M4 Sherman (Late) Tank Company did well to lose the fewest units overall at 1-1.5 per game, and the Panzer Battle Group lost the most units per game, 4. Other Formations with only 1 game have again been omitted from this data view for clarity.
Faction
The Faction make-up for Saltire III was moderately diverse, as we covered in our Operation: Saltire III List Submissions article. Some publications for Late War never made an appearance, such as D-Day: American. It was surprising to see the Fortress Europe book make a showing, though!
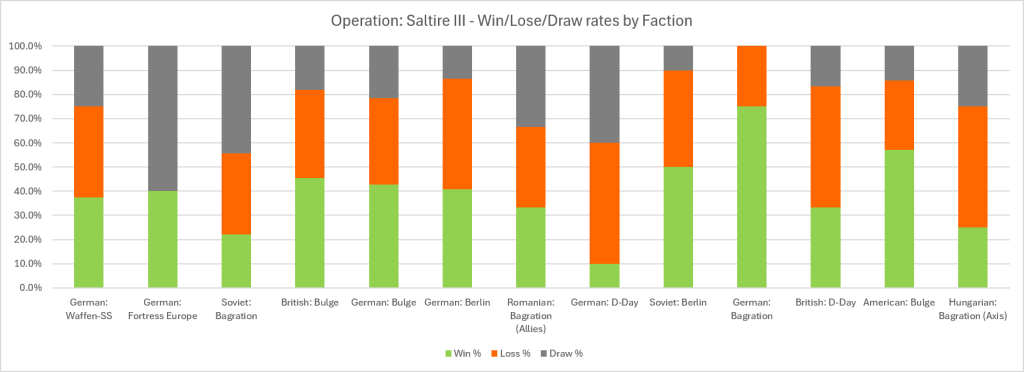
Figure 7- Win/Lose/Draw rates by Faction
So, which Factions did well? According to Figure 7 the top performers for win rate are the Bagration: German, Bulge: American, and Berlin: Soviet Factions with a 50% or greater win rate across the board, potentially due to the points reduction of a few key tank teams. Likewise, it looks like the under-performing Factions this year were D-Day: British, D-Day: German, and Axis Hungarian with a loss rate of 50%.
Mission
Arguably for some, the data on the Missions played during Saltire III will likely be the most interesting aspect. The Mission pack, as of recent, has undergone a series of changes that has sparked some debate amongst the community. Hopefully the information presented in this section might help make some conclusions about Missions clearer when combined with data from other tournaments. Operation: Saltire III was using the Extended Battle plans from the April 2023 experimental release of the Mission pack.
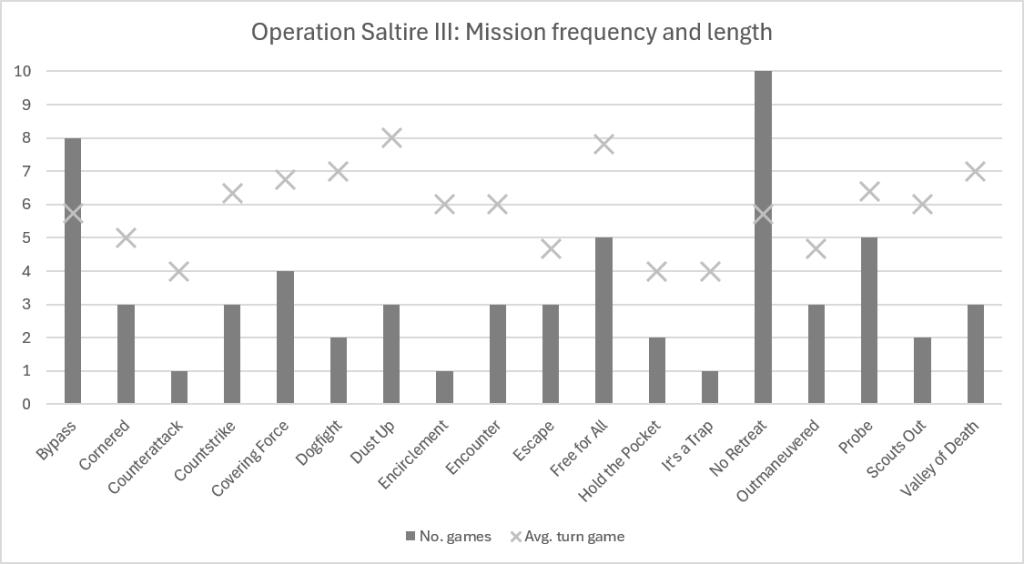
Figure 8 – Mission frequency and length
To see the landscape of Saltire III, you’ll need to understand the Mission selection, shown in Figure 8. We see that “No Retreat” was the most often played mission at 10 matches, followed by “Bypass” at 8. Of these missions, “Dust Up” and “Free for All” (both fairly symmetrical missions) lasted the longest on average before a conclusion at 8 turns. Conversely, “Counterattack”, “Hold the Pocket”, and “It’s a Trap” (all with Defender reserves) are over in 4 turns. It’s worth noting that the latter three games were only played once each over the weekend.
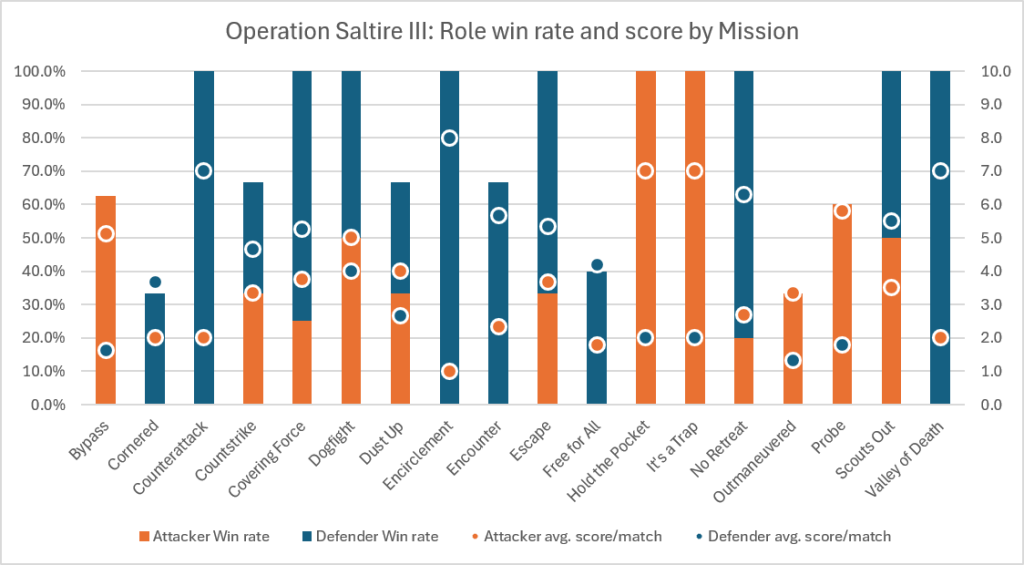
Figure 9 – Role win rate and score by Mission
We can get a good feel for mission balance by observing scores and win rates for the “Attacker” and “Defender” roles in those Missions. Other than Missions that were played once during the event, it looks like “Bypass” and “Probe” were “Attacker” favouring missions according to Figure 9. The “Defender” would do better on “Covering Force”, “Encounter”, “Escape” and “No Retreat”. The least decisive Missions were “Cornered”, “Free for All” and “Outmaneuvered”.
Conclusions
Overall, to reiterate, the information here is only indicative of potential trends and really only represents the state of the tournament itself, especially considering tournament specific rules such as the 2 formation limit and no two formations being the same type. However, we can see that there’s some strength remaining in aggressive and Mechanised Infantry lists, especially on the Attack or Maneuver stances, respectively. We can also see that certain tank lists are quite robust and resist giving points to the opponent. The “Maneuver” stance came out king that weekend, and the Soviets, Germans and Americans came out looking very good after the Dynamic Points changes this year.
Think I’ve missed something key? What about all the other interesting stats you can pull from the data? This article is just a snippet of things that we believe people would like to see, but more processing of the data was performed than is seen here. For a more in-depth look at the data, see the “Source Data” section below and download the “Processed data”.
There you will find more complete tables and information, such as the win rate of Force types on certain missions, stance pick rates for Factions and role win rates for Formations.
Anyway, that’s all from us on the topic of data for now. If you have any suggestions for how we display and process this data, please let us know in the comments, below!
Source data
Raw Combat Command data (Downloaded from the “Stats” tab of the tournament)
Leave a Reply